This page contains a series of computer programs that implement a variety of psychometric and statistical methods for use in clinical research and practice in psychology; they are of particular relevance to clinical neuropsychologists. A subset (e.g. dissocs.exe, singslope.exe, iima.exe, singlims.exe, difflims.exe, clregbiv.exe, etc) are of particular relevance for single-case research in cognitive neuropsychology; for convenience these programs have been gathered together and placed on a separate web page - this latter page also contains versions of some programs (dissocs.exe and singlims.exe) translated into italian and spanish
All programs are for PCs. Once downloaded, these programs can be run by any of the normal Windows procedures i.e. by clicking on file in File Manager, by using Windows start menu, or by placing a shortcut on desktop etc.
When clicking to download the programs: most web browsers are configured to recognise that the files in questions are executables. If you have any problems (i.e. the browser treats them as text files), hold down the shift key when clicking.
As an illustration of these programs, you can view screen captures of the input form and results form; the example is singlims.exe a program for testing whether an individual's score is significantly lower (or higher) than a control sample (the program also provides a point estimate of the abnormality of the individual's score and 95% confidence limits on the abnormality).
![]()

This program for PCs accompanies the paper: Humphris, G., Crawford, J. R., Hill, K., Gilbert, A., & Freeman, R. (2013). UK population norms for the Modified Dental Anxiety Scale with percentile calculator: Adult Dental Health Survey 2009 results. BMC Oral Health, 13: 29. (doi: 10.1186/1472-6831-13-29).
The program (MDAS_PRs.exe) takes an individual's raw score on the Modified Dental Anxiety Scale (MDAS) and expresses the score as a percentile rank. The point estimate of the percentile rank is accompanied by (Bayesian) 95% interval estimates. The overall normative sample size is N =10,990. The norms are stratified by age and gender (users identify their case's age and gender using radio buttons).
Click here to download the program as an executable or here to download as a zip file.
For essential background details see the following paper:
| Humphris, G., Crawford, J. R., Hill, K., Gilbert, A., & Freeman, R. (2013). UK population norms for the Modified Dental Anxiety Scale with percentile calculator: Adult Dental Health Survey 2009 results. BMC Oral Health, 13: 29. (doi: 10.1186/1472-6831-13-29) |
This program for PCs accompanies the following paper: Donders, J., Elzinga, B., Kuipers, D., Helder, E., & Crawford, J. R. (2013). Development of an eight subtest short-form of the WISC-IV and evaluation of its clinical utility in children with traumatic brain injury. Child Neuropsychology, in press .
The program (SF_WISC4_8.exe) scores and analyzes an eight subtest short-form of the WISC-IV. Click here to download the program (559Kb) as an executable or here to download as a zip file (276Kb).
For essential background details see the following paper:
| Donders, J., Elzinga, B., Kuipers, D., Helder, E., & Crawford, J. R. (2013). Development of an eight subtest short-form of the WISC-IV and evaluation of its clinical utility in children with traumatic brain injury. Child Neuropsychology, in press . |
This computer program for PCs accompanies the paper: Crawford, J. R., Cullum, C. M., Garthwaite, P. H., Lycett, E., & Allsopp, K. J. (2012). Point and interval estimates of percentile ranks for scores on the Texas Functional Living Scale. The Clinical Neuropsychologist, 26, 1154-1165. (doi:10.1080/13854046.2012.720713).
The program takes raw subscale scores on the Texas Functional Living Scale (TFLS) and expresses them as Percentile Ranks (PRs). The point estimates of the PRs are accompanied with (Bayesian) interval estimates: these interval estimates quantify the uncertainty arising from using a normative sample to estimate the standing of a case's scores in the normative population. In addition, the program expresses a case's overall T score on the TFLS as a percentile rank and provides an accompanying interval estimate (a parametric method is used to set these latter limits; see paper for details).
To download the program, click here and save to disk (once downloaded click on the program icon to run).
For essential background details see the following paper:
| Crawford, J. R., Cullum, C. M., Garthwaite, P. H., Lycett, E., & Allsopp, K. J. (2012). Point and interval estimates of percentile ranks for scores on the Texas Functional Living Scale. The Clinical Neuropsychologist, 26, 1154-1165. (doi:10.1080/13854046.2012.720713) |
|
These four programs for PCs accompany the paper: Crawford, J. R., Garthwaite, P.H., Denham, K.A., & Chelune, G.J. (2012). Using regression equations built from summary data in the psychological assessment of the individual case: extension to multiple regression. Psychological Assessment, 26, 1154-1165. (doi:10.1080/13854046.2012.720713)
There is a wealth of data that could be used to build regression equations for use in psychological assessment, in turn these equations could be used to draw inferences concerning individual cases. The aim of these programs and accompanying paper is to help provide access to such data. The programs and paper are an extension of Crawford & Garthwaite's (2006; 2007) work on the use of regression in the individual case.
The program RegBuild_MR.exe builds a multiple regression equation for the user from summary data (the correlation matrix for the predictor and criterion variables, and their means and SDs). Having built the equation, the program then permits the user to compare an individual's predicted score with the individual's obtained score. That is, it provides a significance test on the discrepancy between the obtained and predicted score. It also provides a point estimate of the abnormality of the discrepancy (i.e., a point estimate of the percentage of the population exhibiting a larger discrepancy) and accompanying confidence limits on this quantity. Moreover, it provides a point and interval estimate of the effect size for the discrepancy between obtained and predicted scores. Click here to download the program.
A reviewer of an earlier version of the above paper suggested that it would be useful to be able to apply the methods using raw data from a normative or control sample, rather than summary data. To cater for this, a companion program was written, RegBuild_MR_Raw.exe. To use this program the user needs to prepare a text file containing the raw data from the control or normative sample (the program's information panel provides full guidance on how to do this). To download RegBuild_MR_Raw.exe click here.
Crawford & Garthwaite (2007) provided programs for building and applying bivariate regression equations from summary data (i.e., equations using only one predictor variable). As noted above, in the course of developing the present methods for building multiple regression equations, we also developed methods for obtaining point and interval estimates of the effect size for the discrepancy between obtained and predicted scores. As this is a useful feature, we have upgraded Crawford & Garthwaite's (2007) programs to incorporate these point and interval estimates of effect sizes. These programs are differentiated from the original versions by use of a "ES" (effect size) suffix .
Click here to download the upgraded bivariate regression program, Regbuild_ES.exe, and click here to download the upgraded bivariate regression program, Regbuild_t_ES.exe (this latter program can be used when the correlation between predictor and criterion variable is not available - see paper for details).
For essential background details see the following paper:
| Crawford, J. R., Garthwaite, P. H., Denham, K. A., Chelune, G. J. (2012). Using regression equations built from summary data in the psychological assessment of the individual case: Extension to multiple regression. Psychological Assessment, 26, 1154-1165. (doi:10.1080/13854046.2012.720713) |
|
This computer program for PCs accompanies the paper: Crawford, J. R., Garthwaite, P. H., & Longman, R. S, & Batty, A. M. (2012). Some supplementary methods for the analysis of WAIS-IV Index scores in neuropsychological assessment. Journal of Neuropsychology, 6, 192-211.
The program is for use with WAIS-IV Index scores and performs the following supplementary analyses of these scores: (a) provision of traditional confidence intervals on index scores, (b) expressing the endpoints of confidence intervals as percentile ranks; (c) quantifying the number of abnormally low index scores exhibited by a case and accompanying this with an estimate of the percentage of the normative population expected to exhibit at least this number of low scores; (d) quantifying the reliability and abnormality of index score deviations from an individual’s index score mean (thereby offering an alternative to the pairwise approach to index score comparisons available in the WAIS‑IV manual); (e) providing confidence intervals on an individual’s deviation scores or pairwise difference scores, (f) estimating the percentage of the normative population expected to exhibit at least as many abnormal deviations or abnormal pairwise differences as a case; and (g) calculating a case’s Mahalanobis Distance Index (MDI), thereby providing a multivariate estimate of the overall abnormality of an Index score profile. The methods can be applied when only a subset of the Index scores have been administered.
To download the program WAIS4_Supplementary_Analysis.exe click here and save to disk (once downloaded click on the program icon to run).
Alternatively, to download the file as a zip file click here (once downloaded unzip the file).
For essential background details see the following paper:
| Crawford, J. R., Garthwaite, P. H., Longman, R. S., & Batty, A. M. (2012). Some supplementary methods for the analysis of WAIS‑IV Index scores in neuropsychological assessment. Journal of Neuropsychology, 6, 192-211. |
|
This computer program for PCs accompanies the paper: Crawford, J. R., Garthwaite, P. H., Morrice, N., & Duff, K. (in press). Some supplementary methods for the analysis of the RBANS. Psychological Assessment.
The program is for use with RBANS Index scores and performs the following supplementary analyses of these scores: (a) quantifying the number of abnormally low index scores and abnormally large Index score differences exhibited by a case and accompanying this with estimates of the percentages of the normative population expected to exhibit at least this number of low scores and large differences; (b) estimating the overall abnormality of a case’s index score profile using the Mahalanobis Distance Index (MDI); (c) expressing confidence limits on a case’s scores in the form of percentile ranks; (d) reporting confidence limits on differences between a case’s Index scores; and (e) offering the option of applying a sequential Bonferroni correction when testing for reliable differences. The methods can be applied when only a subset of the Index scores have been administered.
To download the program RBANS_Supplementary_Analysis.exe click here and save to disk (once downloaded click on the program icon to run).
Alternatively, to download the file as a zip file click here (once downloaded unzip the file).
Your web browser is most probably configured to recognise that the file is an executable. If you have any problems (i.e. the browser treats them as text files), hold down the shift key when clicking. If your network does not allow downloads of executables then downloading the zip file is a solution.
For essential background details see the following paper:
| Crawford, J. R., Garthwaite, P. H., Morrice, N, & Duff, K.. (in press). Some supplementary methods for the analysis of the RBANS. Psychological Assessment. |
|
This computer program for PCs accompanies the paper: Crawford, J. R., Garthwaite, P. H., Sutherland, D., & Borland, N. (2011). Some supplementary methods for the analysis of the Delis‑Kaplan Executive Function System. Psychological Assessment, 23, 888-898.
The program is for use with D-KEFS achievement scores and performs the following supplementary analyses of these scores: (a) quantifies the number of abnormally low achievement scores exhibited by a case and accompanies this with an estimate of the percentage of the normative population expected to exhibit at least this number of low scores; (b) estimates the overall abnormality of a case’s achievement score profile using the Mahalanobis Distance Index (MDI); (c) calculates a composite Executive Function Index score for a case and provides accompanying confidence limits; and (d) provides the percentile ranks for a case’s achievement scores and Executive Index score (in the latter case confidence limits on scores are also expressed as percentile ranks). The methods can be applied when, as will be common, only a subset of the 16 achievement scores have been administered.
To download the program DKEFS_Supplementary_Analysis.exe click here and save to disk (once downloaded click on the program icon to run).
Alternatively, to download the file as a zip file click here (once downloaded unzip the file).
Your web browser is most probably configured to recognise that the file is an executable. If you have any problems (i.e. the browser treats them as text files), hold down the shift key when clicking. If your network does not allow downloads of executables then downloading the zip file is a solution.
For essential background details see the following paper:
| Crawford, J. R., Garthwaite, P. H., Sutherland, D., & Borland, N. (2011). Some supplementary methods for the analysis of the Delis-Kaplan Executive Function System. Psychological Assessment, 23, 888-898. |
|
These computer programs for PCs accompany the paper: Crawford, J. R., Garthwaite, P. H., and Ryan, K. (2011). Comparing a single case to a control sample: Testing for neuropsychological deficits and dissociations in the presence of covariates. Cortex, 47, 1166-1178.
The programs allow researchers to test for deficits (BTD_Cov.exe & BTD_Cov_Raw.exe) or dissociations (BSDT_Cov.exe & BSDT_Cov_Raw.exe) in the single case allowing for the effects of covariates. They are designed for use in the case-controls design; i.e., when inferences concerning a case are made by comparing the score(s) of the case to the scores obtained by a control sample.
The covariate methods provide the same full range of results provided by our earlier methods. That is they provide : (a) a signficance test (i.e. tests whether we can reject the null hypothesis that the case's score, or score difference, is an observation from the scores, or score differences, in the control population); (b) point and interval estimate of the abnormality of the case's score, or score difference; and (c) point and interval estimates of the effect size for the difference between case and controls
The methods have a wide range of potential applications, e.g., they can provide a means of increasing the statistical power to detect deficits or dissociations, or can be used to test whether differences between a case and controls survive partialling out the effects of potential confounding variables.
Two of the programs (BTD_Cov.exe & BSDT_Cov.exe) take SUMMARY data for the control sample as input (means, SDs, and correlation matrix). The alternative versions of these programs (BTD_Cov_Raw.exe & BSDT_Cov_Raw.exe) take RAW data for the controls as input (i.e., the program computes the means, SDs, and correlation matrix from the raw control data prior to running the tests)
To download BTD_Cov.exe click here and save to disk (once downloaded click on the program icon to run)
To download BTD_Cov_Raw.exe click here and save to disk (once downloaded click on the program icon to run)
To download BSDT_Cov.exe click here and save to disk (once downloaded click on the program icon to run)
To download BSDT_Cov_Raw.exe click here and save to disk (once downloaded click on the program icon to run)
Two further programs that DO NOT allow for the effects of covariates are also available. These are upgraded versions of earlier programs (DiffBayes_ES.exe and DissocsBayes_ES.exe). The updated versions (DiffBayes_ES_CP.exe and DissocsBayes_ES_CP.exe) allow use of a calibrated prior (hence the CP suffix). DiffBayes_ES_CP.exe performs the Bayesian Standardized Difference Test (BSDT) when the analysis does not include covariates. DissocsBayes_ES_CP.exe applies Crawford & Garthwaite's (2007) criteria for classical and strong dissocations and also uses the BSDT and hence was also upgraded to allow use of a calibrated prior. We recommend use of the calibrated prior over the "standard theory" prior used in the earlier versions of these programs (the new programs still offer the standard theory prior as an option but the default is to use the calibrated prior).
To download DiffBayes_ES_CP.exe click here and save to disk (once downloaded click on the program icon to run)
To download DissocsBayes_ES_CP.exe click here and save to disk (once downloaded click on the program icon to run)
Click here to download a zip file containing ALL SIX programs (once downloaded unzip the files and click on the icons to run)
For essential background details see the following paper:
| Crawford, J. R., Garthwaite, P. H., & Ryan, K. (2011). Comparing a single case to a control sample: Testing for neuropsychological deficits and dissociations in the presence of covariates. Cortex, 47, 1166-1178. |
These programs for PCs accompany the paper: Crawford, J. R., Garthwaite, P. H., & Wood, L.T. (2010). Inferential methods for comparing two single cases. Cognitive Neuropsychology, 27, 377-400.
The programs allow researchers to compare the scores of two single cases. Unlike existing methods of comparing two cases, it refers the scores of the two cases to a control sample. All of the methods provide a significance test (one and two-tailed), point and interval estimates of the effect size for the difference, and point and interval estimates of the percentage of pairs of controls that will exhibit a larger difference than that observed for the cases (i.e., these latter statistics quantify the abnormality of the difference).
C_CTC.exe implements a classical test for the difference between the scores of two single cases. Click here to download the executable file; or here to download a zip file containing all five programs.
B_CTC.exe implements a Bayesian Monte Carlo method of examining the difference between the scores of two single cases. The Bayesian and classical methods converge (i.e., the results are identical save for trivial differences arising from Monte Carlo variation); this is reassuring whether one is classical, Bayesian, or eclectic in orientation. Click here to download the program as an executable file; or here to download a zip file containing all five programs.
CTC_Cov.exe compares the scores of two cases on a task of interest but, unlike the first two programs, allows for the effect of a covariate (e.g., a researcher may wish to compare the scores of two single cases allowing for the effect of years of education). Click here to download the executable file; or here to download a zip file containing all five programs.
CTC_Vec_Cov.exe extends CTC_Cov.exe to allow for multiple covariates (i.e., a vector of covariates). It takes summary data for the control sample as input data (i.e., the control means, SDs, and correlation matrix). Click here to download the executable file; or here to download a zip file containing all five programs.
CTC_Vec_Cov_Raw.exe also allows a researcher to compare two cases allowing for multiple covariates but takes raw scores for the control sample as input data . Click here to download the executable file; or here to download a zip file containing all five programs.
For essential background details see the following paper:
| Crawford, J. R., Garthwaite, P. H., Wood, L. T. (2010). The case controls design in neuropsychology: Inferential methods for comparing two single cases. Cognitive Neuropsychology, 27, 377-400. |
This program for PCs accompanies the paper: Garthwaite, P. H., & Crawford, J. R. (2011). Binomial confidence intervals in the presence of ties. Journal of Applied Statistics,, 38, 1915-1934.
This program is for obtaining confidence intervals on a binomial proportion in the presence of ties. It is for use when a confidence interval is required for observations that are discrete but are assumed to relate to an underlying quantity of interest that is continuous. A variety of options are made available that are extensions upon existing methods that cannot incorporate the additional uncertainty created by the presence of tied scores (ie Clopper-Pearson intervals, Agresti-Coull intervals, score form methods etc). The default (recommended) method provides a Bayesian credible interval using a Jeffreys' prior.
Note also that a percentile rank is simply a proportion multiplied by 100 so that this program can be used to get a confidence interval on a case's percentile rank. However, programs that are more specifically tailored for this purpose are available (see below)
Click here to download the program as an executable or here to download as a zip file.
For essential background details see the following paper:
| Garthwaite, P. H., & Crawford, J. R. (2011). Confidence intervals for a binomial proportion in the presence of ties. Journal of Applied Statistics, 38, 1915-1934. |
These six computer programs for PCs accompany the paper: Crawford, J. R., Garthwaite, P. H., and Porter, S. (2010). Point and interval estimates of effect sizes for the case‑controls design in neuropsychology: Rationale, methods, implementations, and proposed reporting standards. Cognitive Neuropsychology, 27, 245-260..
The programs are all new versions of earlier programs: they are upgraded to provide point and interval estimates of effect sizes for the difference between a case and controls.
Details of each program are provided in the table below. To download a program click on its name in the left hand column of the table and save it to disk (once downloaded click on the program icon to run). Alternatively, click here for a zip file containing all six programs.
| Computer Program | Description |
|---|---|
This program is an upgraded version of the program Singlims.exe (Crawford & Garthwaite, 2002). It implements classical methods for comparison of a single‑case’s score to scores obtained in a control sample. The interval estimate of the effect size for the difference between case and controls is obtained using classical methods |
|
This program is an upgraded version of the program SingleBayes.exe (Crawford & Garthwaite, 2007). It implements Bayesian methods for comparison of a single‑case’s score to scores obtained in a control sample. The interval estimate of the effect size for the difference between case and controls is obtained using Bayesian methods |
|
This program is an upgraded version of the program RSDT.exe (Crawford & Garthwaite, 2005). It implements classical methods to test for a difference between a single‑case’s scores on two tasks by comparing the difference against differences observed in a control sample. Note that, although the hypothesis test is a classical test, the interval estimate of the effect size is obtained using Bayesian methods. |
|
This program is an upgraded version of the program DiffBayes.exe (Crawford & Garthwaite, 2007). It implements Bayesian methods to test for a difference between a single‑case’s scores on two tasks by comparing the difference against differences observed in a control sample. The interval estimate of the effect size is obtained using Bayesian methods. |
|
This program is an upgraded version of Dissocs.exe (Crawford & Garthwaite, 2005). It tests if a single‑case meets criteria for a dissociation using classical statistical methods. The interval estimates of the effect size for the difference between the case’s score and controls on each of the two tasks is obtained using classical methods; the interval estimate of the effect size for the difference between tasks is obtained using Bayesian methods. Note also that the upgraded version now offers the option of using a one‑tailed test when testing for a difference between a case’s X and Y scores (a two-tailed test remains as the default) |
|
This program is an upgraded version of Bayes_Dissocs.exe (Crawford & Garthwaite, 2007). It tests if a single‑case meets criteria for a dissociation using Bayesian statistical methods. All interval estimates of effect size are obtained using Bayesian methods. Note also that the upgraded version now offers the option of using a one‑tailed test when testing for a difference between a case’s X and Y scores (a two-tailed test remains as the default) |
For essential background details see the following paper:
| Crawford, J. R., Garthwaite, P. H., and Porter, S. (2010). Point and interval estimates of effect sizes for the case‑controls design in neuropsychology: Rationale, methods, implementations, and proposed reporting standards. Cognitive Neuropsychology, 27, 245-260. |
This program for PCs accompanies the paper: Crawford, J. R., Cayley, C., Wilson, P. H., Lovibond, P. F., & Hartley, C. (2011). Percentile norms and accompanying interval estimates from an Australian general adult population sample for self‑report mood scales (BAI, BDI, CRSD, CES‑D, DASS, DASS‑21, STAI‑X, STAI‑Y, SRDS, and SRAS). The Australian Psychologist, 46, 3-14.
The program (MoodScore_PRs_Aus.exe) takes an individual's raw scores on commonly used mood scales and expresses the scores as percentile ranks. The point estimates of the percentile ranks are accompanied by 95% interval estimates (these can be calculated using either Bayesian or classical statistical methods - the two sets of limits normally give very similar intervals).
Click here to download the program as an executable or here to download as a zip file.
For background details see the following paper:
| Crawford, J. R., Cayley, C., Wilson, P. H., Lovibond, P. F., & Hartley, C. (2011). Percentile norms and accompanying interval estimates from an Australian general adult population sample for self‑report mood scales (BAI, BDI, CRSD, CES‑D, DASS, DASS‑21, STAI‑X, STAI‑Y, SRDS, and SRAS). The Australian Psychologist, 46, 3-14. |
This program for PCs accompanies the following paper: Crawford, J. R., Anderson, V., Rankin, P. M., & MacDonald, J. 2010). An index-based short-form of the WISC-IV with accompanying analysis of reliability and abnormality of differences. British Journal of Clinical Psychology, 49, 235-258.
The program (SF_WISC4.exe) scores and analyzes a seven subtest short-form of the WISC-IV. Click here to download the program (471Kb) as an executable or here to download as a zip file (233Kb).
For essential background details see the following paper:
| Crawford, J. R., Anderson, V., Rankin, P. M., & MacDonald, J. (2010). An index-based short-form of the WISC-IV with accompanying analysis of the reliability and abnormality of differences. British Journal of Clinical Psychology49, 235-258. |
These two programs for PCs accompany the paper: Crawford, J. R., Garthwaite, P. H., and Slick, D.J. (2009). On percentile norms in neuropsychology: Proposed reporting standards and methods for quantifying the uncertainty over the percentile ranks of test scores. The Clinical Neuropsychologist, 27, 1173-1195.
Norms for neuropsychological test scores are often presented in the form of percentile ranks, particularly when the distribution of raw scores departs markedly from a normal distribution. The principal advantage of presenting scores as percentiles is that, unlike standardized scores (e.g., IQs, T scores etc), they inform us directly how common or uncommon an indidividual's score is in the normative population. It is also commonly argued that percentiles have the advantage of simplicity: their meaning is apparently unequivocal. However, the devil can be in the detail: There are three, mutually exclusive, definitions of a percentile in common use (American Educational Research Association, American Psychological Association, & National Council on Measurement in Education, 1999, p. 179). The three defintions are:
Definition A: The percentage of scores that fall below the score of interest
Definition B: The percentage of scores that fall at or below the score of interest
Definition C: The percentage of scores that fall below the score of interest, where half of those obtaining the score of interest are included in the percentage
The percentile rank of a raw score can vary markedly depending on which definition has been employed (see Table 1 in the above paper for an illustration). We suggest that this is an unsatisfactory state of affairs and propose that neuropsychologists attempt to settle on a single definition. It could be argued that which of the three definitions should fulfill this role is of secondary importance compared to the desirability that one (any one) should prevail over the two others. However, there is a strong case for preferring Definition C (see paper for reasons). A further problem is that, when percentile norms are presented, the defintion employed is often not specified. This constitutes an (avoidable) source of uncertainty when using percentile norms.
A second source of uncertainty stems from the fact that a neuropsychologist wishes to establish the standing of a patient's score in the normative population (not in the sample that happened to be used to establish the norms). This uncertainty over the true percentile rank of a raw score is unavoidable but its effects can be quantified using statistical methods developed in the above paper and implemented in the accompanying computer programs.
The program Percentile_Norms_Int_Est.exe implements the reporting standards for percentile norms proposed in the above paper. It takes a file of frequency data for raw scores and generates a table of raw scores with their corresponding percentile ranks. The point estimates of the percentile ranks are accompanied by 95% interval estimates. These intervals can be calculated using Bayesian or classical statistical methods, as developed in the paper (the two sets of limits exhibit a high degree of onvergence).
A second program, Single_PR_PIE.exe, can be used when all that is required is a point and interval estimate of an individual's percentile rank (the inputs are: the number of persons in the normative or control sampe scoring below the individual, the number obtaining the same score as the individual, and the size of the normative sample).
Click here to download the Percentile_Norms_Int_Est.exe program as an executable, here to download Single_PR_PIE.exe, or here to download BOTH programs as a single zip file.
For essential background details see the following paper:
| Crawford, J. R., Garthwaite, P. H., & Slick, D. J. (2009). On percentile norms in neuropsychology: Proposed reporting standards and methods for quantifying the uncertainty over the percentile ranks of test scores. The Clinical Neuropsychologist, 27, 1173-1195. |
This program for PCs accompany the manuscript: Crawford, J. R., Garthwaite, P. H., Lawrie, C.J., Henry, J.D., MacDonald, M.A., Sutherland, J., and Sinha, P. (2009). A convenient method of obtaining percentile norms and accompanying interval estimates for self-report mood scales (DASS, DASS-21, HADS, PANAS, and sAD). British Journal of Clinical Psychology, 48, 163-180.
The program (MoodScore_PRs.exe) takes an individual's raw scores on one of five commonly used mood scales and expresses the scores as percentile ranks. The point estimates of the percentile ranks are accompanied by 95% interval estimates (these can be calculated using either Bayesian or classical statistical methods - the two sets of limits give very similar intervals). The normative data used to provide these percentile norms were obtained from samples of the general adult population. The samples vary in size from 758 (for the sAD scale) to 3,822 (for the HADS scale).
Click here to download the program as an executable or here to download as a zip file.
For essential background details see the following paper:
| Crawford, J. R., Garthwaite, P. H., Lawrie, C.J., Henry, J.D., MacDonald, M.A., Sutherland, J., and Sinha, P. (2009). A convenient method of obtaining percentile norms and accompanying interval estimates for self-report mood scales (DASS, DASS-21, HADS, PANAS, and sAD). British Journal of Clinical Psychology, 48, 163-180. |
This program for PCs accompanies the paper: Crawford, J. R., Garthwaite, P. H., & Betkowska, K. (2009). Bayes Theorem and diagnostic tests in neuropsychology: Interval estimates for post‑test probabilities. The Clinical Neuropsychologist, 23, 624-644.
Most neuropsychologists are aware that, given the specificity and sensitivity of a test and an estimate of the base rate of a disorder, Bayes theorem can be used to provide a post-test probability for the presence of the disorder given a positive test result (and a post-test probability for the absence of a disorder given a negative result). However, in the standard application of Bayes theorem the three quantities (sensitivity, specificity, and the base rate) are all treated as fixed, known, quantities. This is very unrealistic as there may be considerable uncertainty over these quantities and therefore even greater uncertainty over the post-test probability. Therefore, point estimates of the sensitivity and specificity of a diagnostic test should be supplemented with interval estimates. More importantly, point estimates of the post-test probability of a COI (or its absence) should also be supplemented with their corresponding interval estimates.
The program, Post_Test_Probabilities.exe, calculates point and interval estimates for the post-test probability of a condition of interest (COI ) following a positive test result (or point and interval estimates of the probability of being free of a COI following a negative test). The pre-test and post-test probabilities are also plotted to aid in assimilation of the results: An example of such a plot can be found below. The pre-test probability (i.e., the base rate of the COI) can be based on either (a) objective data (i.e., from a prevalence study), (b) subjective opinion, or (c) objective data modified by subjective opnion. Although the program is primarily intended for use in the individual case, it also provides a convenient means of gaining an appreciation of the factors that determine post-test probabilities.
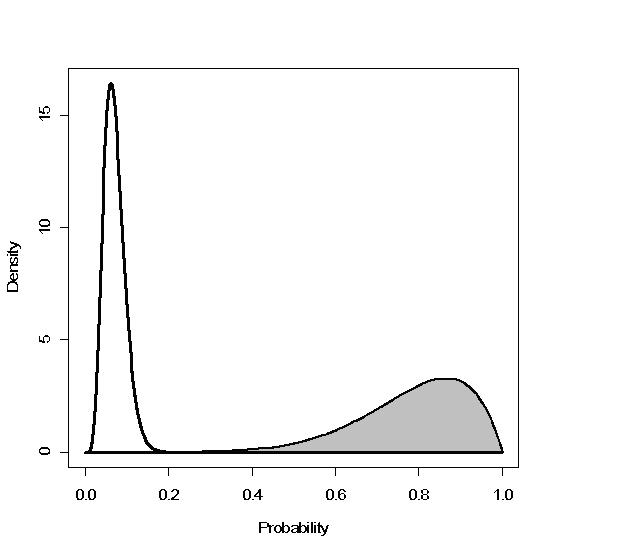
The figure above is an example plot of pre-test (unshaded) and post-test (shaded) probability distributions.
Click here to download the program as an executable or click here to download a zipped version of the program.
For essential background details on the methods implemented in the program see the following paper:
| Crawford, J. R., Garthwaite, P. H., & Betkowska, K. (2009). Bayes Theorem and diagnostic tests in neuropsychology: Interval estimates for post-test probabilities. The Clinical Neuropsychologist, 23, 624-644. |
These programs for PCs accompany the paper : Crawford, J. R. & Garthwaite, P.H. (2009). Percentiles please: The case for expressing neuropsychological test scores and accompanying confidence limits as percentile ranks. The Clinical Neuropsychologist, 23, 193-204.
Some neuropsycholgists have argued that percentiles have no role in the interpretation of test scores (e.g., Bowman, 2002) and have described them as "perfidous". In contrast, the above paper argues that percentiles should occupy a central role. That is, we suggest that neuropsychological test scores should routinely be expressed not only in derived score units (e.g., on an IQ / Index score metric) but also as percentiles. Furthermore, confidence limits that capture the uncertainty arising from measurement error on test scores are usually expressed only in derived score units; we suggest that also expressing the upper and lower limits in the form of percentiles has a number of advantages. Two programs accompany the paper:
The program WAIS3_PRCLME.exe provides percentile rank confidence limits for Index scores on the WAIS-III (confidence limits are also expressed on an Index score metric). A companion program (WISC4_PRCLME) does the same for WISC-IV Index scores. Click here to download WAIS3_PRCLME.exe, and here to download WISC4_PRCLME.
Alternatively both files can be downloaded as a zip file (prclme_both.zip; 451 Kb); click here to download zip file.
For essential background details on the methods implemented in these programs see the following paper:
| Crawford, J. R., & Garthwaite, P. H. (2009). Percentiles please: The case for expressing neuropsychological test scores and accompanying confidence limits as percentile ranks. The Clinical Neuropsychologist, 23, 193-204. |
This program for PCs accompanies the paper: Crawford, J. R., & Garthwaite, P. H. (2008). On the "optimal" size for normative samples in neuropsychology: Capturing the uncertainty when normative data are used to quantify the standing of a neuropsychological test score. Child Neuropsychology, 14, 99-117.
The program (QUAND.exe) quantifies the uncertainty arising from the use of normative sample data to estimate the standing of a raw score. The program has two options: the first allows neuropsychologists to quantify the uncertainty attached to existing normative data; the second is aimed at neuropsychologists planning a normative study.
Click here to download the program (467Kb) as an executable or click here to download as a zip file (233Kb).
For essential background details on the methods implemented in this program see the following paper:
| Crawford, J. R., & Garthwaite, P. H. (2008). On the "optimal" size for normative samples in neuropsychology: Capturing the uncertainty associated with the use of normative data to quantify the standing of a neuropsychological test score. Child Neuropsychology, 14, 99-117. |
These three programs are designed to be used with the BIRT Memory and Information Processing Battery (BMIPB; Coughlan, Oddy, & Crawford, 2007). The BMIPB is a revision and extension of the Adult Memory and Information Processing Battery (AMIPB) . Details of the test battery (including ordering information) can be found by clicking on the test title highlighted above.
BMIPB_Score_V2.exe is intended as a supplement to the percentile tables in the manual. It provides regression-based continuous norms (using age and educational level as predictors) for seven of the primary measures of the BMIPB. Scores are expressed as T score. Note that there was a bug in the original version of this program (BMIPB_Score.exe): the current version (BMIPB_Score_V2.exe) replaces it.
BMIPB_Retester.exe is designed to assist in the interpretation of retest results on the BMIPB, it assumes that Form 1 was used for testing and Form 2 for retesting. Upon entry of the raw test and retest scores, the program uses regression equations to predict retest scores from initial test scores using data from the BMIPB standardization sample. The discrepancy between obtained and predicted scores are standardized and expressed as T scores.
BMIPB_Retester_F2F3.exe is essentially the same as BMIPB_Tetester except that is for use when comparing scores obtained on a third testing (using Form3) with those obtained from an earlier second testing (using Form2).
The methods used in all three programs are largely those developed in papers by Crawford & Garthwaite (2006; 2007).
Downloading the Files:
Click here to download BMIPB_Score_V2.exe
Click here to download BMIPB_Retester.exe
Click here to download BMIPB_Retester_F2F3.exe
| Coughlan, A, K., Oddy, M, J., & Crawford, J. R. (2007). BIRT Memory and Information Processing Battery (BMIPB). London: Brain Injury Rehabilitation Trust. | |
| Crawford, J. R., & Garthwaite, P. H. (2006). Comparing patients’ predicted test scores from a regression equation with their obtained scores: A significance test and point estimate of abnormality with accompanying confidence limits. Neuropsychology, 20, 259-271. |
|
| Crawford, J. R., & Garthwaite, P. H. (2007). Using regression equations built from summary data in the neuropsychological assessment of the individual case. Neuropsychology, 21, 611-620 |
|
This program for PCs accompany the paper: Crawford, J. R., Allum, S., and Kinion, J. E. (2008). An index based short- form of the WAIS-III with accompanying analysis of reliability and abnormality of differences. British Journal of Clinical Psychology, 47, 215-237 .
Short-forms of the WAIS-III are commonly used in clinical psychology and clinical neuropsychology. In contrast to previous short-forms of the WAIS-III, the current short-form (which uses seven subtests) provides clinicians with the same full range of analytic methods that are available when a full-length WAIS-III is used. That is, short-form scores are expressed as index scores (and percentiles) with accompanying confidence limits; the reliability and abnormality of differences between Index scores are also reported along with supplementary analysis (ie Mahalanobis distance measure of the abnormality of the overall Index score profile; the number of scores classified as abnormal together with percentage of general population expected to exhibit that number of abnormal scores, etc).
The program (SF_WAIS3.exe) scores and analyzes the seven subtest short-form of the WAIS-III. Click here to download the program (471Kb) as an executable or here to download as a zip file (233Kb).
For essential background details on the methods implemented in this program (and a worked example) see the following paper:
Crawford, J. R., Allum, S., & Kinion, J. E. (2008). An Index-based short-form of the WAIS-III with accompanying analysis of reliability and abnormality of differences. British Journal of Clinical Psychology, 47, 215-237. |
|
These programs for PCs accompany the paper: Crawford, J. R., & Garthwaite, P. H. (2007). Comparison of a single case to a control or normative sample in neuropsychology: Development of a Bayesian approach. Cognitive Neuropsychology, 24, 343-372.
The programs implement Bayesian inferential methods for use in single-case studies in which a patient is compared to a control sample. A convenient feature of these programs (and other programs available on this page) is that they take summary statistics from the control population as inputs. For SingleBayes.exe the control mean, standard deviation and sample size are required. For programs examining differences between two tasks (DiffBayes.exe and DissocsBayes.exe) the inputs required are the means and SDs for the two tasks in controls, together with the correlation between tasks in controls and the sample n.
SingleBayes.exe uses Bayesian Monte Carlo methods to test if a patient's score is sufficiently below the scores of controls such that the null hypothesis that it is an observation from the control population can be rejected (i.e., it is used to test for a deficit). It also provides a point estimate of the percentage of the control population that would obtain a lower score (i.e., a point estimate of the abnormality of the score) and a 95% credible interval for this quantity. The Bayesian approach gives the same results as the equivalent frequentist test (singlims.exe; Crawford & Howell, 1998; Crawford & Garthwaite, 2002). The convergence is reassuring for single-case researchers regardless of whether they are frequentist or Bayesian in outlook. Note also that, as the Bayesian credible interval and frequentist confidence intervals are equivalent, a Bayesian interpretation can be placed on them, regardless of how they are obtained. Thus the convoluted frequentist interpretation of intervals can be avoided.
Click here to download SingleBayes.exe as an executable; or here to download as a zip file; or here to download a zip file with all three Bayesian tests.
DiffBayes.exe applies Bayesian methods to examine the difference between a patient's scores on two tasks. When it is sensible to examine the raw differences between a patient's scores on two tasks against the raw differences in controls, then the Bayesian Unstandardized Difference Test (BUDT) can be applied. The BUDT provides a signifcance test, a point estimate of the percentage of the control population that will exhibit a larger difference than the patient, and an interval estimate of this quantity. Results form this test converge with those from its its frequentist alternative, the Unstandardized Difference Test (UDT; Crawford and Garthwaite, 2005). As was noted with regard to SingleBayes.exe above, the fact that two very different approaches yield the same result is reassuring for single-case researchers.
A limitation of the BUDT (and the frequentist UDT) is that a comparison of a patient's raw scores on two tasks is often (usually) not meaningful as the tasks differ in their mean and standard deviations. Thus it is usually necessary to standardize the patient's scores on each task (using the data from the controls) . The Bayesian Standardized Difference Test (BSDT) should be applied in these circumstances. This test does not exhibit convergence with its frequentist alternative, the Revised Standardized Difference Test (Crawford & Garthwaite, 2005). The Bayesian test has a number of advantages (see paper for details) including the fact that it factors in the uncertainty over the standard deviations of the two tasks used to standardize the patient's scores (the RSDT is solely concerned with the standardized difference). The Bayesian test can also directly estimate the percentage of the population that will exhibit a larger difference than the patient and, unlike the frequentist test, provides an interval estimate of this quantity.
Click here to download DiffBayes.exe as an executable or here to download as a zip file; or here to download a zip file with all three Bayesian tests.
DissocsBayes.exe tests whether a patient's scores on two tests meet Bayesian criteria for a dissociation (a strong dissociation; or a dissociation, putatively classical). For computational convenience it uses Crawford & Howell's (1998) frequentist test (see also Crawford & Garthwaite, 2002) to test for a deficit on each of the two tasks and the Bayesian Standardized Difference Test (BSDT) to test whether the standardized difference between the patient's scores is sufficiently large to reject the null hypothesis that it is an observation from the distribution of differences in the control population. A strong dissociation is recorded if a patient is classified as exhibiting a defict on both tasks and exhibits a signficant difference (on the BSDT) between their standardized scores on these tasks. A dissociation, putatively classical, is recorded if the patient is classified as exhibiting a defict on one (and only one) of the tasks and exhibits a signficant difference between their standardized scores. Note that the program also has a "belt and braces" option in which a patient's standardized difference has to achieve significance on both the Bayesian test (BSDT) and the equivalent frequentist test (Revised Standardized Difference Test [RSDT]; Crawford and Garthwaite, 2005).
Click here to download DissocsBayes.exe as an executable or here to download as a zip file; or here to download a zip file with all three Bayesian tests
For essential background details on the methods implemented in these programs (and worked examples) see the following paper:
Crawford, J. R., & Garthwaite, P. H. (2007). Comparison of a single case to a control or normative sample in neuropsychology: Development of a Bayesian approach. Cognitive Neuropsychology, 24, 343-372. |
|
These programs for PCs accompany the paper: Crawford, J. R., & Garthwaite, P. H. (2007). Using regression equations built from summary data in the neuropsychological assessment of the individual case. Neuropsychology, 21, 611-620.
There is a wealth of data that could be used to build regression equations for use in neuropsychology, in turn these equations could be used to draw inferences concerning single-cases. The aim of these programs and accompanying paper is to help provide access to such data. For example, there are numerous studies reporting the test-retest correlation between neuropsychological tests, as the means and SDs at test and retest are usaully also reported, these summary statistics can be used to build an equation to test for change in a single-case's test performance
The programs and paper are an extension of Crawford & Garthwaite's (2006) and Crawford & Howell's (1998) work on the use of regression in the individual case (see next section). Unlike the programs regdiscl.exe and regdisclv.exe, the above programs do not require that the user has access to an existing regression equation. The program regbuild.exe builds the regression equation for the user from summary data (the correlation between the predictor and criterion variables and their mean and SDs). Having built the equation, the program then permits the user to compare an individual's predicted score with an obtained score.
Even when the correlation between predictor and criterion is not available it will still often be possible to build an equation from summary statistics - the correlation can be "recovered" if a study reports the results of a paired t-test or ANOVA comparing predictor and criterion variables. The program regbuild_t.exe performs the same tasks as the main program (regbuild.exe) but is used in this latter situation.
Click here to download both programs as a single zip file.
Note: these programs have been replaced with updated versions (that add point and interval estimates of effect size for the case's discrepancy).:
Crawford, J. R., & Garthwaite, P. H. (2007). Using regression equations built from summary data in the neuropsychological assessment of the individual case. Neuropsychology, 21, 611-620. |
|
These programs for PCs accompany the paper: Crawford, J. R. , Garthwaite, P. H. & Gault, C. B. (2007). Estimating the percentage of the population with abnormally low scores (or abnormally large score differences) on standardized neuropsychological test batteries: A generic method with applications. Neuropsychology, 21, 419-430.
In neuropsychological assessment a fundamental question is whether an individual's test scores are abnormally low. Relatedly, it is important to estimate the abnormality of differences between an individual's scores. However, neuropsychological testing involves multiple tests. For example, suppose an abnormal score is defined as a score exhibited by less than 5% of the general population and that an individual exhibits two abnormally low scores on a test battery of 10 tests. It would be useful to know the base rate in this situation; that is, what percentage of the general population would be expected to exhibits this number of abnormal tests. The same holds when the concern is with abnormal differences between tests, i.e., if a patient exhibits three abnormal differences between pairs of tests in a battery, what percentage of the general population is expected to exhibit this number of abnormal pairwise differences?
The generic program (PercentAbnormK.exe) uses Monte Carlo simulation to estimate (A) the percentage of the population expected to exhibit j or more abnormally low scores on a standardized test battery, (B) the percentage expected to exhibit j or more abnormally large deviations from individuals' mean scores on a battery, and (C) the percentage expected to exhibit j or more abnormally large pairwise differences between tests in a battery. The criterion used to define abnormality is selected from a list of ten alternatives (e.g., an abnormally low score can be defined as a score exhibited by less than 5% of the population, or as a score one standard deviation below the mean etc). The program requires the correlation matrix for the tests (although, where these are unkown, it can be used in an exploratory fashion to estimate base rates under different assumptions for these correlations)
Two further programs are available; these are specifically tailored to analyzing WAIS-III and WISC-IV Index scores (WAISIII_Percent_Abnorm.exe and WISCIV_Percent_Abnorm.exe). The programs take an individual's scores on the four WAIS or WISC Indices as input. The program calculates the abnormality of the Index scores and differences between Index scores. The number of scores and score differences meeting the user-defined criterion for abnormality is then recorded along with the percentage of the general population expected to exhibit this number (or more) of abnormal scores or score differences.
Click here to download all three programs as one zip file.
Click here to download PercentAbnormK.exe as an executable (456Kb) or here to download a zipped version of the program (229KB).
Click here to download WAISIII_Percent_Abnorm.exe as an executable (456Kb) or here to download a zipped version of the program (229KB). Please note: this is version 2 of the program (hence v2 extension) the original had a bug which is now fixed.
Click here to download WISCIV_Percent_Abnorm.exe as an executable (456Kb) or here to download a zipped version of the program (229KB). Please note: this is version 2 of the program (hence v2 extension) the original had a bug which is now fixed.
For essential background details on the methods implemented in these programs (and worked examples) see the following paper:
Crawford, J. R., Garthwaite, P. H., & Gault, C. B. (2007). Estimating the percentage of the population with abnormally low scores (or abnormally large score differences) on standardized neuropsychological test batteries: A generic method with applications. Neuropsychology, 21, 419-430. |
|
These programs for PCs accompany the paper: Crawford, J. R. & Garthwaite, P.H. (2006). Comparing patients’ predicted test scores from a regression equation with their obtained scores: a significance test and point estimate of abnormality with accompanying confidence limits. Neuropsychology, 20, 259-271.
Regression equations are widely used in neuropsychology to draw inferences concerning the cognitive status of individual patients. For example, an equation predicting retest scores from scores at original testing can be used to test whether there has been change in a patient's level of functioning. Equations can also be used as an alternative to conventional normative data by providing "continuous norms" as when a patient's score on a neuropsychological test is compared to the score predicted by their age (sse paper for further examples).
These programs test if there is a significant discrepancy between an individual's obtained and predicted score (one- and two-tailed p values are provided). They also provide a point estimate of the abnormality of the discrepancy (i.e., a point estimate of the percentage of the population exhibiting a larger discrepancy) and accompanying confidence limits on this quantitiy.
A commonly used alternative to these methods of analyzing the discrepancy between obtained and predicted scores involves dividing the discrepancy by the equation's standard error of estimate and treating the result as a standard normal deviate (the p value for this z is then obtained from a table of areas under the normal curve). Monte Carlo simulations show that, unlike the method implemented in these programs, the latter method does not control Type I errors and overestimates the abnormality of an individual's discrepancy. In addition, because it does not acknowledge the uncertainty associated with sample regression statistics, it cannot provide confidence limits on the abnormality of the discrepancy.
The program regdiscl.exe is for use with bivariate regression equations (ie single predictor). Click here to download the program (462Kb)
The program regdisclv_V2.exe is for use with multiple regression equations and requires that you have access to the correlation matrix for the sample used to build the equation. (The program has the suffix V2 as this is an updated version to fix a bug in the original. Click here to download the program (463Kb)
Alternatively both files can be downloaded as a zip file; click here (465 Kb)
For essential background details on the methods implemented in these programs (and worked examples) see the following paper:
Crawford, J. R., & Garthwaite, P. H. (2006). Comparing patients’ predicted test scores from a regression equation with their obtained scores: A significance test and point estimate of abnormality with accompanying confidence limits. Neuropsychology, 20, 259-271. |
|
This PC program (PRMQPROXY.EXE) accompanies the paper by Crawford, J.R., Henry, J.D. Ward, A. L., & Blake, J. (2006). The Prospective and Retrospective Memory Questionnaire (PRMQ): Latent structure, normative data and discrepancy analysis for proxy-ratings” British Journal of Clinical Psychology, 45, 83-104.
The PRMQ (Smith et al, 2000) is a memory rating scale and is available in self-rating and proxy-rating versions. The program is for use with the proxy-rating version (click here for a program for use with self-rating version). The program takes an individual's raw proxy-rating scores on the Prospective and Retrospective scales as input and provides T scores, estimated true scores, and 95% confidence limits for all three scales. It also tests whether the discrepancy between the Prospective and Retrospective scales is reliably different, and records the estimated percentage of the population that will exceed the observed discrepancy (i.e., it addresses the issue of whether the discrepancy is rare/abnormal). In addition to being a quick and convenient means of scoring and analysing the PRMQ, the program also helps to avoid clerical errors.
Click here to download (436k) the program (i.e. save it to disk). Your web browser is probably configured to recognise that the file is an executable. If you encounter any problems (i.e. the browser treats it as a text file), try holding down the shift key when clicking. A zipped version of this program (221Kb) can be obtained here. Once downloaded, the program can be run by any of the normal Windows procedures, i.e. by clicking on the file in Windows explorer, by using Windows start menu, or by placing on desktop etc.
For essential background details on the methods implemented in these programs (and worked examples) see the following paper:
Crawford, J. R., Henry, J. D., Ward, A. L., Blake, J. The Prospective and Retrospective Memory Questionnaire (PRMQ): Latent structure, normative data and discrepancy analysis for proxy-ratings. British Journal of Clinical Psychology, 45, 83-104. |
|
These programs accompany the paper: Crawford, J. R. & Garthwaite, P.H. (2005). Testing for suspected impairments and dissociations in single-case studies in neuropsychology: Evaluation of alternatives using Monte Carlo simulations and revised tests for dissociations. Neuropsychology, 19, 318-331.
Crawford & Garthwaite (2005) argue that previous definitions of a dissociation used in single-case research in neuropsychology are insufficiently rigorous and lack precision. Building on criteria initially proposed by Crawford, Garthwaite & Gray (2003), they present revised and fully specified criteria for classical and strong dissociations. Monte Carlo simulations show that the Type I error rate is low using these criteria
The program DISSOCS.EXE can be used to apply Crawford & Garthwaite’s (2005) revised criteria for classical and strong dissociations. To achieve this it tests whether a patient’s scores on tasks X and Y are significantly lower than those of a control sample, it then tests whether the standardized difference between a patient’s X and Y scores are statistically significant (using the Revised Standardized Difference Test; see below). Finally, it reports whether the patient’s pattern of performance meets the criteria for a classical or strong dissociation. A patient is considered to fulfill the criteria for a classical dissociation if they are significantly different from controls on one of the two tasks and their standardized difference between tasks is significantly different from controls. A patient is considered to fulfill the criteria for a strong dissociation if they are significantly different from controls on both tasks and their standardized difference between tasks is significantly different from controls.
Click here to download the program DISSOCS.EXE (463Kb). If your browser security settings don’t permit you to download executables or if you have a slow connection then you can download a zipped version of the program (231Kb)
We have also written a program RSDT.EXE. This program can be used when a researcher or clinician is interested only in whether the standardized difference between a patients X and Y scores is significantly different from controls (i.e. this program could be used when a researcher does not want to test whether X or Y is lower than controls nor in whether a patient meets criteria for classical or strong dissociation). This program applies Crawford & Garthwaite’s Revised Standardized Difference Test (RSDT)
Click here to download the program RSDT.EXE (463Kb). If your browser security settings don’t permit you to download executables or if you have a slow connection then you can download a zipped version of the program (221Kb).
Note: Thanks to Professor Patrizio Tressoldi, University of Padua, these programs have been translated into Italian. Click here for details.
For essential background details on the methods implemented in these programs (and worked examples) see the following paper:
|
Crawford, J. R. & Garthwaite, P.H. (2005). Testing for suspected impairments and dissociations in single-case studies in neuropsychology: Evaluation of alternatives using Monte Carlo simulations and revised tests for dissociations”. Neuropsychology, 19, 318-331. |
|
Further background can be found in the following paper:
|
Crawford, J.R., Garthwaite, P.H., & Gray, C. D. (2003). Wanted: Fully operational definitions of dissociations in single-case studies. Cortex, 39, 357-370. |
For further evaluation of these methods (including their robustness in the face of severely skewed or leptokurtic data) see the following paper:
| Crawford, J. R. & Garthwaite, P. H. (2005b). Evaluation of criteria for classical dissociations in single-case studies by Monte Carlo simulation. Neuropsychology, 19, 664-678. |
|
This latter paper also compares conventional criteria for classical dissociations with criteria based on the above methods: the conventional criteria are associated with alarmingly high Type I error rates
This PC program (TVARDIFF.EXE) accompanies the paper: Garthwaite, P.H. and Crawford, J. R. (2004). “The distribution of the difference between two t-variates”. Biometrika, 91, 987-994.
The program allows the user to test for a difference between two t-variates. The most common application of this method will be to test whether the difference between an individual's standardized scores on two variables (X and Y) is significantly different from the differences observed in a control sample. A program specifically tailored to this latter use is available (RSDT.EXE; see above).
Click here to download the program TVARDIFF.EXE (435Kb). If your browser security settings don’t permit you to download executables or if you have a slow connection then you can download a zipped version of the program (231Kb)
For essential background details on the method implemented in this program see the following paper:
Garthwaite, P. H. & Crawford, J. R. (2004). The distribution of the difference between two t-variates. Biometrika, 91, 987-994. |
|
This PC program (singslope.exe) accompanies the paper by Crawford & Garthwaite (2004). Statistical methods for single-case research in neuropsychology: Comparing the slope of a patient's regression line with those of a control sample. Cortex, 40, 533-548.
In single-case studies and in clinical practice some constructs are quantified not by a conventional score (such as number of items correct) but as a measure of association. This paper and accompanying program extends work by Crawford, Garthwaite, Howell, & Venneri (in press) (see program IIMA.EXE below) to cover situations where a patient’s performance is expressed as the slope of regression line. Examples include quantifying a patient’s distance estimation using the slope relating actual distance to estimated distance (or time estimation using the slope relating actual elapsed time and estimated elapsed time). The computer program is designed to allow single-case researchers or clinicians to test whether the slope of a patient’s regression line is significantly different from those of a control sample; it also provides a point estimate of the abnormality of the patients score (i.e. it estimates the percentage of the control population that would obtain a more extreme slope and provides a 95% confidence interval for this percentage).
Click here to download (463KB) the program (i.e. save it to disk). Your web browser is probably configured to recognise that the file is an executable. If you encounter any problems (i.e. the browser treats it as a text file), try holding down the shift key when clicking.
Once downloaded, the program can be run by any of the normal Windows procedures, i.e. by clicking on the file in Windows explorer, by using Windows start menu, or by placing on desktop etc.
For essential background details on the methods implemented in this program (and worked examples) see the following paper:
Crawford, J. R., & Garthwaite, P.H. (2004) Statistical methods for single-case research in neuropsychology: Comparing the slope of a patient's regression line with those of a control sample. Cortex, 40, 533-548. |
|
This PC program (iima.exe) accompanies the paper by Crawford, J. R., Garthwaite, P. H., Howell, D. C., & Venneri, A. (2003) Intra-individual measures of association in neuropsychology: Inferential methods for comparing a single case with a control or normative sample. Journal of the International Neuropsychological Society, 9, 989-1000.
In single-case studies and in clinical practice some constructs are quantified not by a conventional score (such as number of items correct) but as an intra-individual measure of association (i.e., a correlation coefficient). Examples include quantifying temporal order memory by calculating the correlation between the order material was presented and a person’s memory for that order, or quantifying an individual’s tone perception etc. The computer program is designed to allow single-case researchers or clinicians to test whether the correlation (parametric or non-parametric) obtained from a patient is significantly different from those of a control sample; it also provides a point estimate of the abnormality of the patients score (i.e. it estimates the percentage of the control population that would obtain a more extreme correlation and provides a 95% confidence interval for this percentage).
Click here to download (463KB) the program (i.e. save it to disk). Your web browser is probably configured to recognise that the file is an executable. If you encounter any problems (i.e. the browser treats it as a text file), try holding down the shift key when clicking. If your browser security settings don’t permit you to download executables or if you have a slow connection then you can download a zipped version of the program (231Kb). Once downloaded, the program can be run by any of the normal Windows procedures, i.e. by clicking on the file in Windows explorer, by using Windows start menu, or by placing on desktop etc.
For essential background details on the methods implemented in this program (and worked examples) see the following paper:
Crawford, J. R., Garthwaite, P.H, Howell, D. C., & Venneri, A. (2003). Intra-individual measures of association in neuropsychology: Inferential methods for comparing a single case with a control or normative sample. Journal of the International Neuropsychological Society, 9, 989-1000. |
|
This PC program is designed to test for a difference between the fit of two competing confirmatory factor analytic (CFA) models and implements a method described by Satorra and Bentler (2001). One of the models must be a more constrained version of the other (e.g., the more constrained model does not permit a correlation between two factors that is permitted in the less constrained model). Such models are termed nested models and can be compared using a test on the difference between chi square for the models. However, if the data depart markedly from multivariate normality, the Satorra-Bentler scaled chi square statistic (S-B 2) should be used to provide an improved estimate of the fit of a model. The problem here, however, is that the difference between these scaled statistics is not itself distributed as chi square (Satorra & Bentler, 2001). To deal with this, Satorra & Bentler (2001) have provided a correction that, when applied, allows you to validly compare models. To run such a test requires entry of the following: the normal chi square values for the models being compared, the Satorra-Bentler scaled chi square values for these models, and the degrees of freedom for the models (the output from the structural equation modeling program EQS provides all of these statistics). The output consists of the scaled difference between the models and the significance of this difference (the scaled difference is evaluated against a chi square distribution with k degrees of freedom, where k = the df for the more constrained model minus the df for the less constrained model). The program has extensive error checking which will prevent inexperienced users going astray.
Click here to download the program (436Kb). If your browser security settings don’t permit you to download executables, or if you have a slow connection, then you can download a zipped version of the program (231Kb).
Essential background information and details of the scaled difference test can be found in:
Satorra, A., & Bentler, P. M. (2001). A scaled difference chi-square test statistic for moment structure analysis. Psychometrika, 66, 507-514. |
|
The program was written to accompany Crawford & Henry (2003). This paper, and the others listed below, contain examples of the use of the program:
Crawford, J. R., & Henry, J. D. (2004). The Positive and Negative Affect Schedule (PANAS): Construct validity, measurement properties and normative data in a large non-clinical sample. British Journal of Clinical Psychology, 43, 245-265. |
|
Crawford, J. R., & Henry, J. D. (2003). The Depression Anxiety Stress Scales: Normative data and latent structure in a large non-clinical sample. British Journal of Clinical Psychology, 42, 111-131. |
|
Henry, J. D., Crawford, J. R., Bedford, A., Crombie, C., & Taylor, E. P. (2002). The personal disturbance scale (sAD): normative data and latent structure in a large non-clinical sample. Personality and Individual Differences, 33, 1343-1360. |
|
This PC program (prmqscor.exe) accompanies the paper by Crawford, Smith, Maylor, Della Sala, & Logie (in press) and is for use with the self-rated version of the Prospective and Retrospective Memory Questionnaire (PRMQ; Smith et al., 2000). The PRMQ is a 16 item questionnaire that systematically assesses prospective and retrospective memory across a variety of contexts. Confirmatory factor analysis indicates that it yields a general factor of self-rated memory and specific factors of self-rated prospective and retrospective memory. Norms are based on a sample of the general adult population (N= 551) with an age range of 17 to 94.
The program takes an individual’s raw scores on the Prospective and Retrospective scales as input and provides T scores, estimated true scores, and 95% confidence limits for all three scales. It also tests whether the discrepancy between the Prospective and Retrospective scales is reliably different, and records the estimated percentage of the population that will equal or exceed the observed discrepancy (i.e., it addresses the issue of whether the discrepancy is rare/abnormal). In addition to being a quick and convenient means of scoring and analysing the PRMQ, the program also helps to avoid clerical errors.
Click here to download (436KB) the program (i.e. save it to disk). Your web browser is probably configured to recognise that the file is an executable. If you encounter any problems (i.e. the browser treats it as a text file), try holding down the shift key when clicking.
Once downloaded, the program can be run by any of the normal Windows procedures, i.e. by clicking on the file in Windows explorer, by using Windows start menu, or by placing on desktop etc.
For essential background details on the methods implemented in this program (and worked examples) see the following paper:
Crawford, J. R., Smith, G. V., Maylor, E. A. M. Della Sala, S., & Logie, R. H. (2003). The Prospective and Retrospective Memory Questionnaire (PRMQ): Normative data and latent structure in a large non-clinical sample. Memory, 11, 261-275. |
|
The paper describing the original development of the PRMQ is as follows:
Smith, G. V., Della Sala, S., Logie, R. H., & Maylor, E. A. M. (2000). Prospective and retrospective memory in normal ageing and dementia: A questionnaire study. Memory, 8, 311-321 |
|
These three PC programs accompany the paper by Crawford & Garthwaite (2002). It builds on earlier work by Crawford & Howell (1998) and Crawford, Howell & Garthwaite (1998). These previous papers presented statistical methods for comparing an individual case with a small normative or control sample (fuller details can be found elsewhere on this web page). The papers provided significance tests and a point estimate of the abnormality (i.e. rarity) of an individual's score. The current work provides methods for obtaining confidence limits on the estimates of abnormality. It also extends the methods of obtaining point estimates to cover the case where an individual's score on each of k tests is compared with the individual's mean score on the k tests. That is, the method can now be applied to examining an individual's cognitive strengths and weaknesses across a set of measures. This sort of analysis was first used by A.B. Silverstein to analyze individuals' profiles of performance on the Wechsler intelligence scales. The Silverstein method treats the statistics of the normative or control sample as population parameters. This is not a problem when, as is the case with the Wechsler scales, the normative sample is very large. However, it is a problem if the normative data for a test were obtained from a sample with a modest N. For example, in many single case studies in neuropsychology, the control samples against which an individual is compared often have very small Ns. The present work provides a method that treats the normative sample statistics as sample statistics rather than as population parameters.
SINGLIMS.EXE is for comparison of an individual's score on a single test with the score of a normative or control sample (it replaces an earlier program singt.exe). It provides a significance test, point estimate of the abnormality of the individual's score, and confidence limits on the abnormality. Click here to download SINGLIMS.EXE (452KB). If your browser security settings don’t permit you to download executables or if you have a slow connection then you can download a zipped version of the program (231Kb)
DIFFLIMS.EXE tests whether the difference between scores on two tests observed for a patient is significantly greater than the differences observed for a control or normative sample. It provides the significance test, point estimate of the abnormality of the difference and confidence limits on the abnormality of the difference (it replaces an earlier program pairabno.exe). Click here to download DIFFLIMS.EXE (453KB). Please Note: An improved test on the standardized difference between two tasks is now available. This test, the Revised Standardized Difference Test (RSDT) is available above. We recommend you use the RSDT in preference to DIFFLIMS.EXE
PROFLIMS.EXE tests whether the difference between an individual's score on each of k tests and the individual's mean score on the k tests is significantly different from the differences observed in a normative or control sample. It provides the significance test, point estimates of the abnormality of the differences and confidence limits on the abnormality of the differences. Click here to download PROFLIMS.EXE (453KB).
For essential background details (and worked examples) see the following paper:
Crawford, J.R., & Garthwaite, P.H. (2002). Investigation of the single case in neuropsychology: Confidence limits on the abnormality of test scores and test score differences. Neuropsychologia, 40, 1196-1208. |
|
Note: I am grateful to Professor Sytse Knypstra of the Department of Econometrics, University of Groningen for the use of an algorithm for finding the non-centrality parameter of non-central t distributions; this algorithm is used in all three programs.
This PC program (hmgt.exe) accompanies the paper by Crawford & Warrington (2002). It provides confidence limits on scores on the Homophone Meaning Generation Test (HMGT). The HMGT is a new verbal fluency measure that has been shown to be sensitive to the presence of anterior lesions (Warrington, 2000). The program also estimates an individual’s premorbid performance on the HMGT from NART scores and analyses the discrepancy between the estimated premorbid score and the HMGT score obtained on testing.
Click here to download the program.
For essential background on the methods implemented in the program (and an example of their use) see the following paper:
Crawford, J.R. & Warrington, E.K. (2002). The Homophone Meaning Generation Test: Psychometric properties and a method for estimating premorbid performance. Journal of the International Neuropsychological Society, 8, 547-554. |
|
For details of the HMGT see:
| Warrington, E.K. (2000). Homophone meaning generation: A new test of verbal switching for the detection of frontal lobe dysfunction. Journal of the International Neuropsychological Society, 6, 643-648. |
|
This PC program (diffdef.exe) accompanies the paper by Crawford, Blackmore, Lamb, and Simpson (2000). It provides a method of testing for differential deficits; i.e. it can be used to test whether the deficit exhibited by a clinical sample on Test A is significantly greater than the deficit exhibited on Test B. It does this by applying William's (1959) test for non-independent correlations: the correlation between group membership (clinical versus control) and Test A is compared with the correlation of group membership and Test B. Computing a correlation between group membership and a variable is equivalent to running a t-test or one-way ANOVA comparing the groups on the variables, i.e. the p value for the correlation is identical to the p value obtained from the t-test or ANOVA. However, by using correlations one can readily test whether the deficit on Test A is significantly greater than the deficit on Test B.
The same analysis can be run using the program DEPCOR.EXE (see below). The present version simply avoids any potential confusion by labelling the variables specifically for the purpose of testing for differential deficits.
Click HERE to download the program.
For essential background details (and an example) see the following paper:
Crawford, J.R., Blackmore, L. M., Lamb, A., and Simpson, S. A. (2000). Is there a differential deficit in fronto-executive functioning in Huntingtons’s Disease? Clinical Neuropsychological Assessment, 1, 3-19. |
|
These PC programs accompany the paper by Crawford & Howell (1998). They implement inferential methods for comparing an individual's obtained score on a neuropsychological test with a predicted score derived from a regression equation. These methods are liable to of greatest use when the regression equation was built from a small sample. Therefore they will be helpful in single case studies in cognitive neuropsychology in which, typically, control sample are modest in size. Crawford & Howell (1998) showed that, with larger samples, there were only modest differences between results obtained from these technically correct methods and the more common (but technically incorrect) method of dividing the discrepancy by the standard error of estimate and referring this quantity to a table of the area under the normal curve.
Click here to download the CLREGBIV.EXE program (designed for use with bivariate regression equations) and here to download CLREGMUL.EXE (for use with multiple regression equations). For essential background details see the paper:
Crawford, J. R., & Howell, D. C. (1998). Regression equations in clinical neuropsychology: An evaluation of statistical methods for comparing predicted and observed scores. Journal of Clinical and Experimental Neuropsychology, 20, 755-762. |
|
Note: These programs have been superceded by the programs regdisclv.exe and regdisclv.exe (see above). The latter programs perform the analyses but also provide a point estimate and confidence limits on the abnormality of the discrepancy between an individual's predicted and obtained score. In addition, the results from these new programs can be saved to a text file or printed.
This PC program accompanies the paper by Crawford and Howell (1998b). It implements a modified t-test which can be used to compare an individual's test score against norms derived from small samples. It is intended for use in clinical practice or for neuropsychologists conducting single case research. To download the program click here.
For essential background details see the paper:
Crawford, J. R. & Howell, D. C. (1998). Comparing an individual's test score against norms derived from small samples. The Clinical Neuropsychologist, 12, 482-486. |
|
Note: This program has essentially been superceded by the program singlims.exe (see above). The latter program carries out the test performed by singt.exe but also provides confidence limits on the abnormality of an individual's score. In addition, the results from singlims.exe can also be saved to a text file or printed.
This PC program accompanies the paper by Crawford, Howell, and Garthwaite (1998). It extends the method covered in Crawford & Howell (1998) [see above] to allow clinicians or researchers to compare the magnitude of the difference between a pair of tests exhibited by an individual, with the differences observed in a control or normative sample. To download the program click here.
For essential background details see the paper:
| Crawford, J. R., Howell, D.C., & Garthwaite, P.H. (1998). Payne and Jones revisited: Estimating the abnormality of test score differences using a modified paired samples t-test. Journal of Clinical and Experimental Neuropsychology, 20, 898-905. |
|
Note: This program has been superceded by the program RSDT.exe (see above). The latter program achieves control of Type I errors at all values of N (the size of the control or normative sample) and correlation between the two tasks. The results from RSDT.exe can also be saved to a text file or printed.
A program for PCs that estimates premorbid WAIS-R IQ from demographic variables and compares the estimated IQ with an individual's IQ obtained from testing. The regression equations were built in a healthy UK sample (N=200, census-matched). To download click here.
For essential background details see the accompanying paper:
| Crawford, J. R. & Allan, K.M. (1997). Estimating premorbid IQ with demographic variables: regression equations derived from a U.K. sample. The Clinical Neuropsychologist, 11, 192-197. |
|
A program for PCs that implements a regression equation for the estimation of an individual's premorbid verbal fluency (FAS) performance from NART performance. The program compares the estimated premorbid fluency score with the score obtained from testing. The regression equation was built in a healthy UK sample (N=142) and is widely used in research and practice. To download click here.
For essential background details see the accompanying paper:
Crawford, J. R., Moore, J. W. & Cameron, I. M. (1992). Verbal fluency: a NART-based equation for the estimation of premorbid performance. British Journal of Clinical Psychology, 31, 327-329. |
|
A program for PCs that estimates the reliability and abnormality of subtest deviations from the subtest mean for the Test of Everyday Attention (TEA). It can be used with short-form administrations. This method of profile analysis complements the normative comparison standards provided in the TEA manual by providing individual comparison standards. (In response to queries, the required Map Search scaled score is that obtained for 2 minutes). To download click here. Details of the TEA can be found on Ian Robertson's web pages (click here).
For essential background details on the psychometric methods implemented in the program see the accompanying paper:
Crawford, J.R., Sommerville, J. & Robertson, I.H. (1997). Assessing the reliability and abnormality of subtest differences on the Test of Everyday Attention. British Journal of Clinical Psychology, 36, 609-617. |
These programs implement useful tests on correlations and are not available in many standard commercial statistics packages.
DEPCOR.EXE implements William's (1959) test for a significant difference between dependent correlations (i.e. correlations obtained from the same sample). This test has a large number of potential applications. For example, it can be used to compare the correlations of two competing predictor variables with a criterion variable. As a specific example, Crawford et al. (1996) used it to compare the criterion validities of competing short-forms of the WAIS-R.
It can also be used in neuropsychological applications to test for the presence of differential deficits. For example, Crawford et al. (2000) used this method to examine the executive hypothesis of normal ageing. They tested whether age effects on measures of executive dysfunction significantly exceeded age effects on measures known to be relatively insensitive to executive dysfunction (i.e. Wechsler IQs); i.e. they tested whether the age / executive correlations significantly exceed the age/ IQ correlations.
As another example, Crawford et al. (1997) used it to demonstrate that the deficit on the attention/ concentration factor of the WAIS-R in a sample of head-injured participants significantly exceeded deficits observed on all other WAIS-R indices. When used in this situation the correlation between measure A (in this specific example the attention/ concentration factor scores) and group membership (clinical case vs control case) is compared with the correlation for measure B (in this specific example some other WAIS-R index, eg perceptual organisation factor scores), and group membership. A modified version of DEPCOR.EXE which is specifically tailored for this purpose can be found above.
To download DEPCOR.EXE click here.
INDEPCOR.EXE is for testing for a significant difference in independent correlations (i.e. comparing correlations obtained from two samples). As an example, in Crawford et al. (1996) this procedure was used to compare the criterion validity coefficients obtained for WAIS-R short-forms in a standardisation sample (Crawford et al., 1992) with those obtained in a cross-validation sample. To download INDEPCOR.EXE click here.
Howell (1997) provides worked examples for both these procedures.
References are as follows:
Crawford, J. R., Allan, K. M. & Jack, A. M. (1992). Short-forms of the UK WAIS-R: regression equations and their predictive accuracy in a general population sample. British Journal of Clinical Psychology, 31, 191-202. |
|
Crawford, J., Bryan, J., Luszcz, M., Obonsawin, M., & Stewart, L. (2000). The executive decline hypothesis of cognitive ageing: Do executive deficits qualify as differential deficits and do they mediate age-related memory decline? Aging, Neuropsychology and Cognition, 7, 9-31. |
|
Crawford, J. R., Mychalkiw, B., Johnson, D. A. & Moore, J.W. (1996). WAIS-R short-forms: Criterion validity in healthy and clinical samples. British Journal of Clinical Psychology, 35, 638-640. |
|
Crawford, J. R., Johnson, D. A., Mychalkiw, B. & Moore, J. W. (1997). WAIS-R performance following closed head injury: A comparison of the clinical utility of summary IQs, factor scores and subtest scatter indices. The Clinical Neuropsychologist, 11, 345-355. |
|
Howell, D. C. (2002). Statistical methods for Psychology, (4th ed.). Belmont CA: Duxbury Press. |
|
A program for PCs that compares individuals' obtained PASAT scores with their scores predicted from (1) age and NART performance and (2) age and WAIS-R performance.
Although it was originally claimed that performance on the Paced Auditory Serial Addition Task (PASAT) was independent of general intellectual ability it is clear that this view is untenable. For example, in Crawford et al's (1998) confirmatory factor analysis of the PASAT and the WAIS-R, PASAT's loading on general intelligence was higher than most WAIS-R subtests. This indicates that an individual's premorbid intellectual ability should be factored in when interpreting PASAT performance (e.g. a score that was average when compared to normative data could still represent a decline from a previously higher level of ability in an individual of high premorbid intellectual ability).
The program provides a regression equation to estimate an individual's premorbid performance on PASAT using the National Adult Reading Test (NART) and age as predictors. The estimated premorbid score is then compared with the score obtained on testing to assess whether there has been a decline from a previously higher level of functioning.
The second regression equation addresses the issue of whether any PASAT deficit observed in an individual qualifies as a differential deficit, i.e. does it significantly exceed the level of impairment on a global measure of current intellectual functioning (WAIS-R Full Scale IQ).
To download the program click here. For essential background details see the accompanying paper:
Crawford, J. R., Obonsawin, M. C., & Allan, K. M. (1998). PASAT and components of WAIS-R performance: Convergent and discriminant validity. Neuropsychological Rehabilitation, 8, 255-272. |
|
A program for PCs that estimates the reliability and abnormality of subtest deviations from an individual's subtest mean for the WAIS-R. It can be used with short-form administrations.
To download click here. For essential background details on the psychometric methods implemented in the program see the accompanying papers:
|
Crawford, J. R. & Allan, K. M. (1996). WAIS-R subtest scatter: Base rate data from a healthy UK sample. British Journal of Clinical Psychology, 35, 235-247. |
|
|
Crawford, J. R., Allan, K. M., McGeorge, P. & Kelly, S.M. (1997) Base rate data on the abnormality of subtest scatter for WAIS-R short-forms. British Journal of Clinical Psychology, 36, 433-444. |
|
|
Crawford, J. R. (1997). WAIS-R short-forms: assessing the statistical significance of subtest differences. British Journal of Clinical Psychology, 36, 601-618. |
|
The National Adult Reading Test (NART) is widely used to estimate premorbid ability in clinical neuropsychology. However, there is accumulating evidence that NART performance can be impaired in some neurological disorders. This program implements a multiple regression equation that can be used to predict an individual's NART performance from demographic variables (age, sex, years of education, and occupational code). The demographic estimate of NART performance is compared with the obtained score to evaluate the likelihood that the NART will provide a valid estimate of premorbid ability. The equation was built in a healthy UK sample (N= 659).
To download click here. For essential background information see the following paper:
Crawford, J. R., Allan, K. M., Cochrane, R. H. B. & Parker, D. M. (1990). Assessing the validity of NART estimated premorbid IQs in the individual case. British Journal of Clinical Psychology, 29, 435-436. |
|
Although primarily designed for use in clinical practice with individuals, the equation can also be used in research studies to evaluate whether NART performance "holds" in specific neuropsychiatric disorders. For an example of this use see the following paper:
O'Carroll, R. E., Moffoot, A., Ebmeier, K. P., & Goodwin, G. M. (1992). Estimating pre-morbid intellectual ability in the Alcoholic Korsakoff Syndrome. Psychological Medicine, 22, 903-909. |
|
A program that calculates the Mahalanobis Distance Index of the abnormality of an individual's subtest scatter on the WAIS-R. The method was developed by Burgess (1991). The current version can only be used with a full-length WAIS-R; I may get round to modifying it for use with short-forms. To download click here.
For essential background details on the psychometric methods implemented in the program see the following papers:
Burgess, A. (1991). Profile analysis of the Wechsler Intelligence Scales: a new index of subtest scatter. British Journal of Clinical Psychology, 30, 257-263. |
|
Crawford, J. R. & Allan, K. M. (1994). The Mahalanobis distance index of WAIS-R subtest scatter: psychometric properties in a healthy UK sample. British Journal of Clinical Psychology, 33, 65-69. |
|
NOTE: A study of the MDI casts doubt on its sensitivity in detecting acquired impairment in head injury. See the following paper:
Crawford, J. R., Johnson, D. A., Mychalkiw, B. & Moore, J. W. (1997). WAIS-R performance following closed head injury: A comparison of the clinical utility of summary IQs, factor scores and subtest scatter indices. The Clinical Neuropsychologist, 11, 345-355. |
|
The author of this software (John R Crawford) and the University of Aberdeen make no representations about the suitability of the software or about any content or information made accessible by the software, for any purpose.
The software is provided 'as is' without express or implied warranties, including warranties of merchantability and fitness for a particular purpose or noninfringement.
The software is provided gratuitously and, accordingly, the author shall not be liable under any theory or any damages suffered by you or any user of the software.
If there are any problems please e-mail me at j.crawford@abdn.ac.uk. Further contact details are available in the footer of this page.