Windows of Astronomy |
||
Photometry In the second century BC, the Greek astronomy Hipparchus described stars in three brightness categories. The basis of the modern system of magnitudes, in which a range of about 6 magnitudes covers stars visible to the naked eye, is attributed to Ptolemy some 300 years later. Ptolemy may have flagged brightness variation as a fact but no-one seemed to give it much significance or query the reason why stars varied in brightness. Of course the brightest stars featured in navigation and astrology but the ‘why’ question didn’t seem to be on the agenda. Even when stars fainter than could be seen with the naked eye were discovered in the seventeenth century, for over a century very little attention was given to measuring stellar brightness. Recognising that our sensitivity to brightness is logarithmic, Pogson in the 1850s set up the ‘modern’ magnitude scale, with 5 steps corresponding to a brightness change of 100. This makes 1 step correspond to a difference in brightness of the fifth root of 100, namely 2.512. Like Honours degrees, the smaller the number the more brilliant the star. Yes, it would have been better if stellar magnitude had been called 'stellar faintness'. So much for the theory. By Pogson’s time it had been recognised that all stars were not equally far away and distance would affect how bright a star appeared. Increasing the distance by a factor of 10 would decrease the brightness by 100 and increase the magnitude designation by 5. It would turn out that distance is not the biggest influence on brightness. The biggest influence is temperature. A star 10 times hotter than the Sun (and a few are) has a radiant output 10,000 times that of the Sun, though a lot of that is in the ultraviolet. Determining distance from a star’s brightness you need to know its temperature. The hotter a star, the bluer it is. A simple way of estimating temperature has been to measure the brightness (magnitude) of a star through a blue filter (calling the result B) and measure the same star through a green filter (call it V for visible). The difference B-V is the colour index, quoted for many catalogued stars. Colour index is related to a star’s temperature and its spectroscopic type (referred to above under ‘spectroscopy’). You get more precise information with a spectroscope but it’s a quick and comparatively simple method to characterise individual stars. More subtle is the variability of stars. Unlike our Sun, many stars are variable in their output. The change in the magnitude and the timespan of the change separates different types of star. For some Cepheid Variables there is a close link between the period of the changes and their intrinsic brightness (called absolute magnitude). This makes them ‘standard candles’, a key to deriving stellar distances out to some 10 million light years. The photometric properties of ‘type 1A supernovae’ have also been recognised as standard candles and have allowed distances beyond 1000 million light years to be found. Yet another case of variability is that caused by planets transiting across the face of a star. It is through photometry that we now know of the existence of thousands of extra-solar planets around other stars. Brightness has three important connections: distance, temperature and variability. How is brightness measured? It can be estimated by eye by comparing with a light of known brightness but it is basically a photometric quantity that can be measured electronically. Curiously enough, infrared sensors were developed before optical ones. Seebeck discovered the thermoelectric effect in 1821 and thermopiles followed in the next decade. These produced a detectible electric current when one side is slightly heated. The discovery in the 1870s that the resistance of selenium varied depending on how much light was shone onto it was the beginning of electronic photometry. Later, photocells were constructed so that the photoelectric material sealed in a vacuum tube emitted a current (of electrons) when illuminated. Nowadays, photocells use solid state circuitry, usually based on silicon.
|
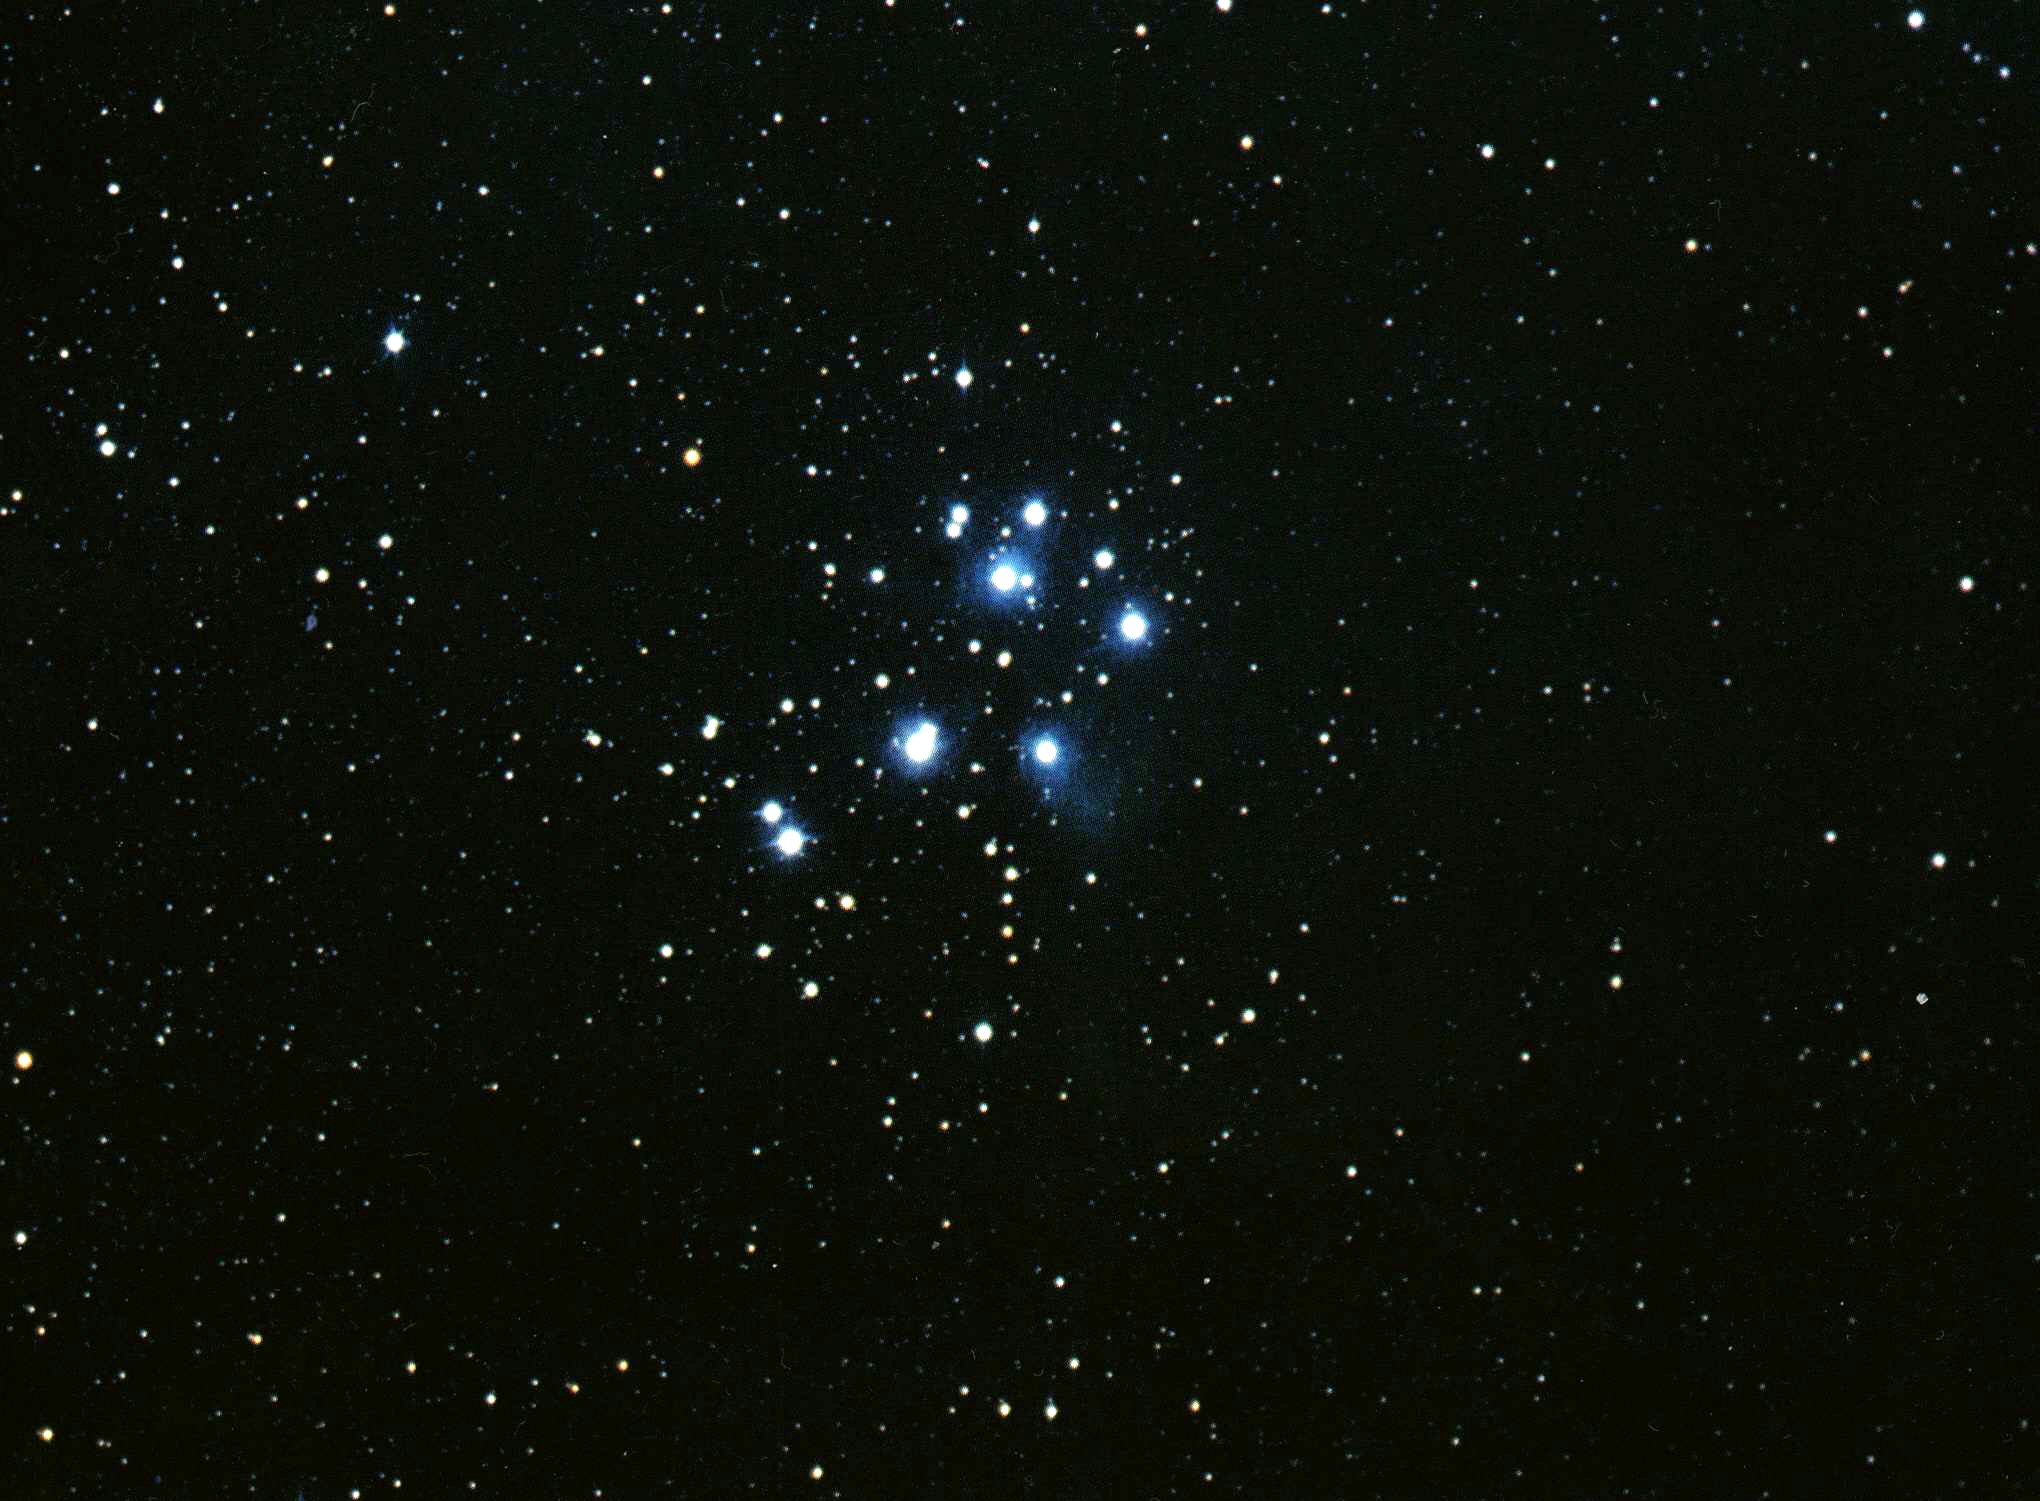
A section of the sky around the Pleiades showing that stars vary in brightness. Before the advent of electronic measurements, the relative brightness of stars in an image was estimated by their sizes on the photographic plate. In this image, the intrinsically brightest stars are exciting nearby gas that adds extra blue nebulosity. Courtesy NASA. |
|
It’s hard not to overuse the word ‘astonishing’ when describing the techniques employed and the knowledge found by astronomers. If the 19th century non-astronomer was astonished that the detailed composition of stars could be found (by spectroscopy), the 21st century non-astronomer may be equally astonished that astronomers can determine the internal structure of stars. I haven’t seen this done but it seems very likely that a detailed analysis of the sound of a bell will allow someone who hasn’t seen the bell to deduce in quite fine detail its size, variations in shape and thickness and even some of its flaws. Stars are huge but they also ring. We can’t hear them since sound doesn’t travel across the near vacuum of space and instead of vibrating several hundred times a second they ring more nearly at one vibration in a thousand seconds. How a star rings is determined by its internal structure so if the spectrum of its modes of oscillation can be determined then we learn about its internal structure. Astonishing! Two methods are used to probe the ringing. One is very precise photometry. The other is very careful examination of the fine motion of stellar spectral lines. The Sun can be examined in fine detail (helioseismology) and stars in less detail (asteroseismology). There are ‘spin off’ determinations of stellar sizes and ages
|
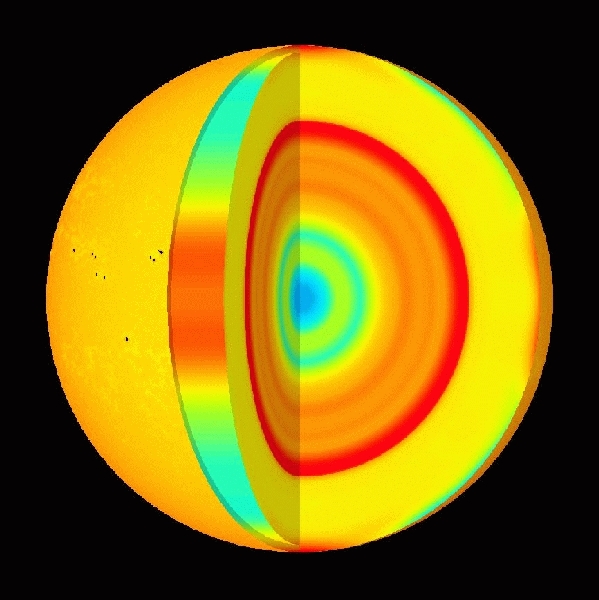
Helioseismometry, courtesy NASA/ESA. Concentric layers in a cutaway image showing oddities in the speed of sound in the deep interior of the Sun, as gauged by two instruments on the SOHO probe. |
|


