This program for PCs accompanies the paper: Crawford, J. R., Garthwaite, P. H., & Betkowska, K. (2009). Bayes Theorem and diagnostic tests in neuropsychology: Interval estimates for post‑test probabilities. The Clinical Neuropsychologist, 23, 624-644.
Most neuropsychologists are aware that, given the specificity and sensitivity of a test and an estimate of the base rate of a disorder, Bayes theorem can be used to provide a post-test probability for the presence of the disorder given a positive test result (and a post-test probability for the absence of a disorder given a negative result). However, in the standard application of Bayes theorem the three quantities (sensitivity, specificity, and the base rate) are all treated as fixed, known, quantities. This is very unrealistic as there may be considerable uncertainty over these quantities and therefore even greater uncertainty over the post-test probability. Therefore, point estimates of the sensitivity and specificity of a diagnostic test should be supplemented with interval estimates. More importantly, point estimates of the post-test probability of a COI (or its absence) should also be supplemented with their corresponding interval estimates.
The program, Post_Test_Probabilities.exe, calculates point and interval estimates for the post-test probability of a condition of interest (COI ) following a positive test result (or point and interval estimates of the probability of being free of a COI following a negative test). The pre-test and post-test probabilities are also plotted to aid in assimilation of the results: An example of such a plot can be found below. The pre-test probability (i.e., the base rate of the COI) can be based on either (a) objective data (i.e., from a prevalence study), (b) subjective opinion, or (c) objective data modified by subjective opnion. Although the program is primarily intended for use in the individual case, it also provides a convenient means of gaining an appreciation of the factors that determine post-test probabilities.
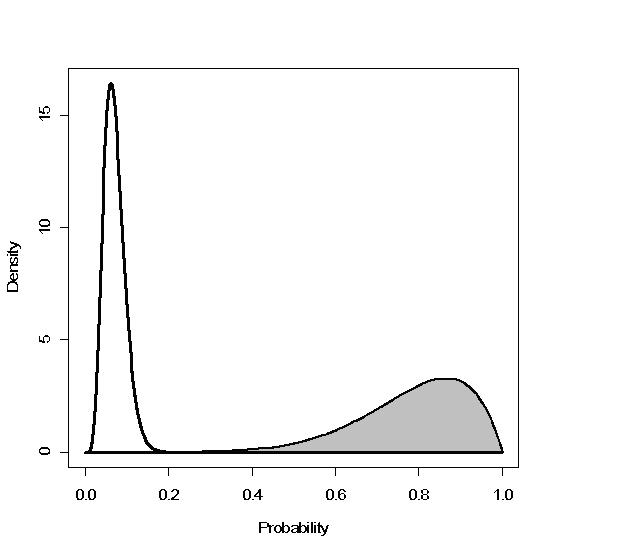
The figure above is an example plot of pre-test (unshaded) and post-test (shaded) probability distributions.
Click here to download the program as an executable or here or click here to download a zipped version.
Your web browser is most probably configured to recognise that the files are executable. If you have any problems (i.e. the browser treats them as text files), hold down the shift key when clicking. If your network does not allow downloads of executables then downloading the zip file is a solution.
Once downloaded, the programs can be run by any of the normal Windows procedures i.e. by clicking on file in File Manager or by placing on desktop etc.
The author of this software (John R Crawford) and the University of Aberdeen make no representations about the suitability of the software or about any content or information made accessible by the software, for any purpose.
The software is provided 'as is' without express or implied warranties, including warranties of merchantability and fitness for a particular purpose or noninfringement.
The software is provided gratuitously and, accordingly, the author shall not be liable under any theory or any damages suffered by you or any user of the software.
If there are any problems please e-mail me at j.crawford@abdn.ac.uk. Further contact details are available in the footer of this page.